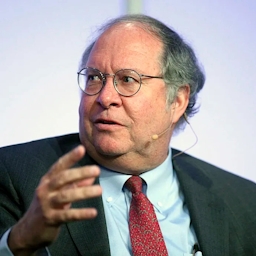
Miller Value Partners, Llc (Bill Miller)
Basic Stats
Market Value
219.41M
Top 10 (%)
56.5%
Portfolio Size (Change from Prev.)
34 (1)
Avg. Holding Period
10 years
Turnover
0.2%
Industry Breakdown
Life Insurance
13.1%
Services-business Services, Nec
9.4%
Drilling Oil & Gas Wells
7.4%
Television Broadcasting Stations
7.0%
Commercial Printing
6.4%
Telephone Communications (no Radiotelephone)
5.6%
Pharmaceutical Preparations
5.5%
Real Estate Investment Trusts
5.2%
Gas & Other Services Combined
4.4%
Newspapers: Publishing Or Publishing & Printing
3.6%
Ticker | Company | Market Value | % Portfolio | Shares | Chg. Shares % | Chg. Shares | Quarter End Price | % Owned |
|---|---|---|---|---|---|---|---|---|
LNC | Lincoln Natl Corp Ind | 18.65M | 8.5% | 519.3K | 5.2% | 25.6K | 36.00 | 0.3% |
NBR | Nabors Industries Ltd | 16.21M | 7.4% | 388.7K | 38.2% | 107.6K | 42.00 | 3.7% |
BFH | Bread Financial Holdings Inc | 15.52M | 7.1% | 309.8K | 1.9% | 5.8K | 50.00 | 0.6% |
GTN | Gray Media Inc | 15.46M | 7.0% | 3.6M | 5.7% | 193.3K | 4.00 | 3.7% |
QUAD | Quad / Graphics Inc | 14.03M | 6.4% | 2.6M | 2.2% | 56.1K | 5.00 | 5.4% |
JXN | Jackson Financial Inc | 10.13M | 4.6% | 121.0K | -12.0% | -16.4K | 84.00 | 0.2% |
UGI | Ugi Corp New | 9.66M | 4.4% | 292.0K | — | — | 33.00 | 0.1% |
VZ | Verizon Communications Inc | 8.98M | 4.1% | 198.0K | New Buy | 198.0K | 45.00 | 0.0% |
GCI | Gannett Co Inc | 7.84M | 3.6% | 2.7M | 13.2% | 316.2K | 3.00 | 1.9% |
CTO | Cto Rlty Growth Inc New | 7.41M | 3.4% | 383.9K | — | — | 19.00 | 1.2% |
OMF | Onemain Hldgs Inc | 7.28M | 3.3% | 149.0K | — | — | 49.00 | 0.1% |
BMY | Bristol-myers Squibb Co | 6.59M | 3.0% | 108.0K | — | — | 61.00 | 0.0% |
WAL | Western Alliance Bancorp | 6.41M | 2.9% | 83.5K | -40.9% | -57.7K | 77.00 | 0.1% |
CHRD | Chord Energy Corporation | 5.95M | 2.7% | 52.8K | — | — | 113.00 | 0.1% |
VTRS | Viatris Inc | 5.39M | 2.5% | 619.0K | — | — | 9.00 | 0.1% |